How Do We Measure Water Levels?
Introduction
Since the early 1800's, NOAA and its predecessor organizations have been measuring, describing and predicting tidal phenomena, determining datums for boundary applications and maintaining the International Great Lakes Datum. This database has become one of the most extensive, accurate and significant geophysical data sets in existence.
The Former System and Its Limitations
The former water level measurement system, based on technologies and methods developed in the nineteenth century, has served oceanographers well over the years, providing them with a unique capability to describe and understand tidal phenomena. However, that system suffered from some major limitations, namely:
- nonlinearity, aliasing and biasing problems with the analog-to-digital recorder;
- susceptibility to recording error due to reliance on human observations;
- susceptibility to marine fouling;
- obsolete measurement and data processing systems; and
- a need for constant tending and maintenance.
The Challenge
The water level measurement problem can be visualized by examining the figure below. For the operational applications important to the National Ocean Service and its customers tidal information must be extracted out of the total wave power spectrum. The energy from the rest of the spectrum is due to wind generated waves and is unwanted in the data. But, the rejection of the energy from those unwanted portions of the spectrum must be performed in such a manner that no aliasing or biasing errors are introduced.
-
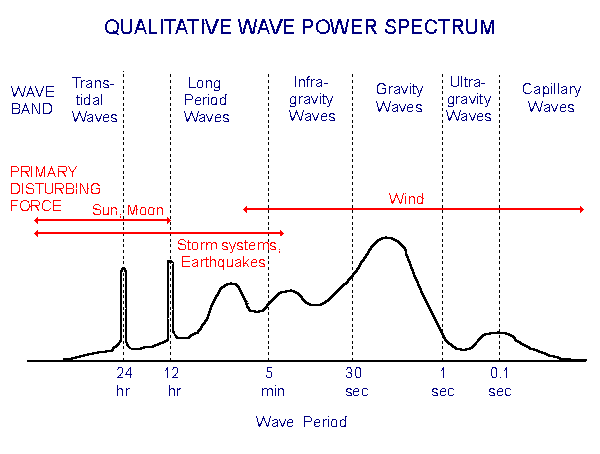
Schematc (and fanciful) representation of the energy contained in the surface waves of the ocean - in fact, a guess at the power spectrum
Reference: Kinsman, Blair, Wind Waves: Their Generation and Propagation on the Ocean Surface. Prentice-Hall, Inc., Englewood Cliffs, New Jersey, 1965, p. 23.
The New System
To address the limitations of former system and the measurement challenge above, the National Ocean Service has developed and deployed a new state-of-the-art water level measuring system. This upgrade involved the replacement of the entire former system, from the water level sensor and field data collection system to the headquarters-based data acquisition, processing, analysis and dissemination system. The new system goes by the name Next Generation Water Level Measurement System (NGWLMS). The NGWLMS uses sensors incorporating new technologies and microprocessor-based data collection and recording subsystems. Not only does the designed directly improve the data collection process, it also captures data quality assurance parameters allowing scientists to make additional judgements about the reliability of the data.
To solve the nonlinearity, aliasing and biasing problems of the former system, the new system employs a less restrictive protective well. This less restrictive well only screens out waves with a period shorter than 2-3 seconds. However, by admitting higher frequency waves than the former system did, it is now necessary to sample the water level more rapidly. Fortunately the newer technology is capable of just this feat. Furthermore, the data are filtered by the microprocessor-based data collection subsystem in a way that filters out the unwanted frequencies. This non-mechanical filtering approach has been made possible by using remote sensing techniques that can obtain samples of rapidly changing water levels.
Other issues are also solved by use of the new technologies. For example, the new primary water level sensor is an air acoustic measurement device. It is both self-calibrating for variations in the speed of sound and can be leveled directly to local benchmarks that provide absolute measurements referenced to local water level datums. These new capabilities obviate the need for a human observer at the tide gauge. Also, with the data being monitored and processed in near real-time system malfunctions are detected more quickly. In fact, the capabilities of the new system go far beyond just solving old problems. For instance, the technology offers a whole suite of new possibilities for data dissemination including:
- acquisition of near real-time water level data from the system and fully automated data processing;
- accommodation by the system of as many as eleven ancillary sensors;
- the capability of real-time water level data for navigation;
- the capability of line-of-site radio links to ships supporting real-time hydrography operations and harbor traffic control;
- acquisition and dissemination of data products through computer network links;
- real-time data to support NOAA's Storm Surge warning and Tsunami warnings;
- determination of absolute changes in sea level by correlating with the Global Positioning System and Very Long Baseline Interferometric measurements in support of climate and long-term sea level applications.
Comparison of the Former and New Systems
Comparisons show that the design improvements of the protective well, the averaging data sampling scheme, the elimination of the tide observer and staff-to-gauge comparisons, the satellite, radio and telephone telemetry, and the improved timing have all result in a higher quality data set than that from the former ADR/Bubbler systems. With the new systems, NOAA has been able to disseminate higher quality data much more quickly to the research and maritime community, as well as a host of other new users.