coastal_and_greatlakes

Coastal Forecasts

Oceans & Great Lakes

oceanmaps-view-top-oceanic-wl image

OceansMap is presently a beta release. If you find any bugs or have any questions or comments please contact our customer service email account (Tide.Predictions@noaa.gov).

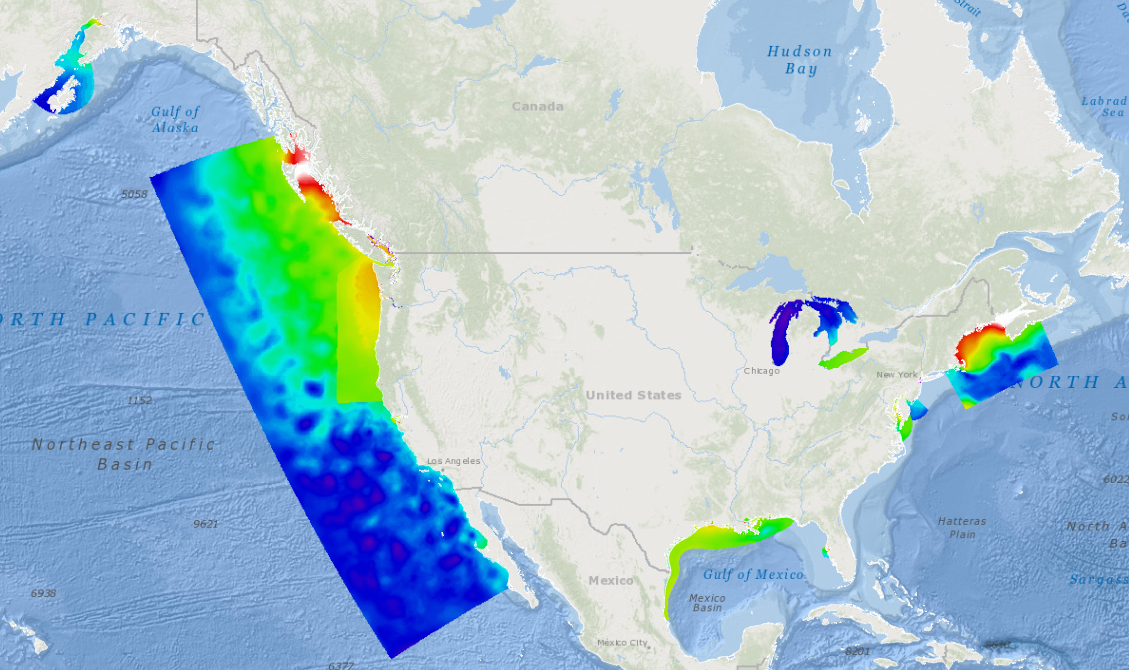
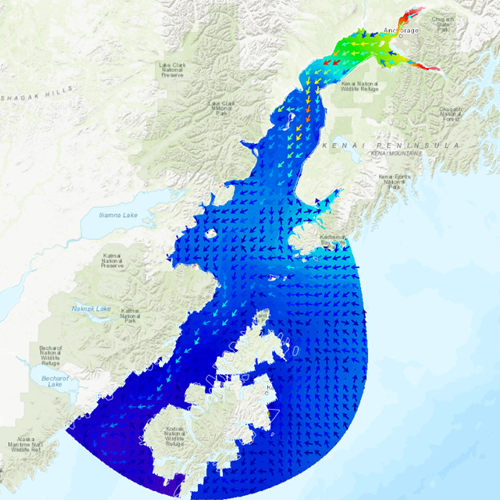
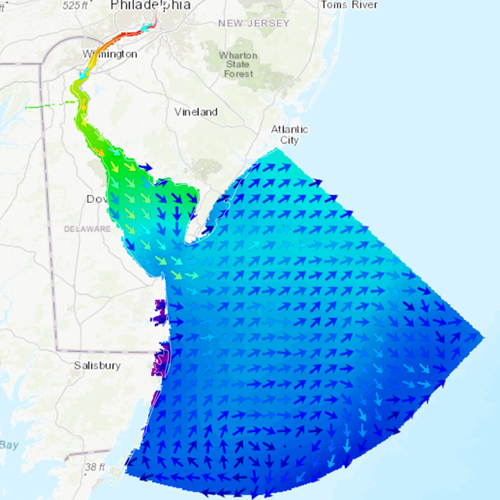
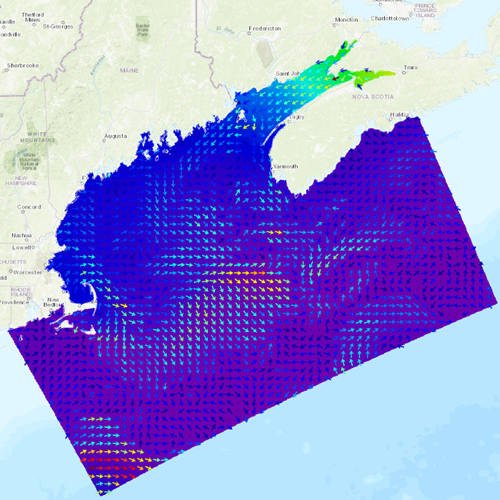
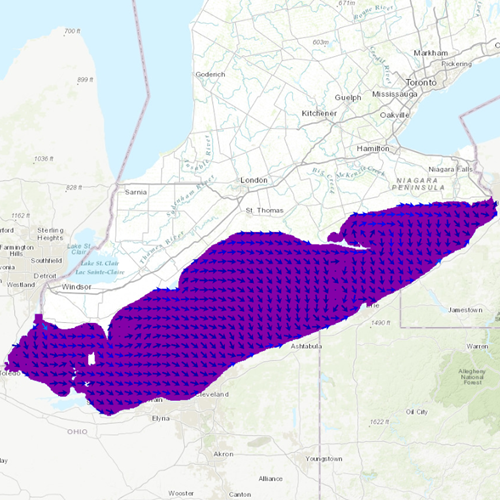
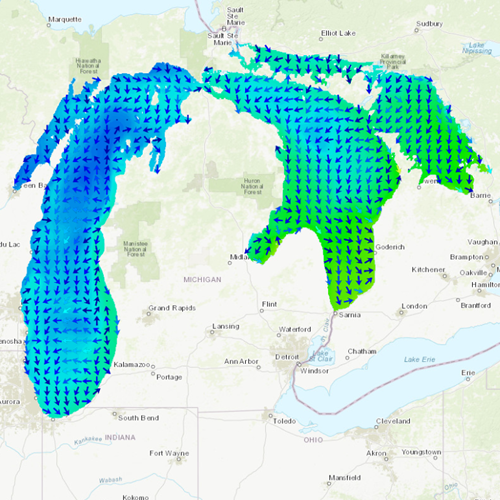
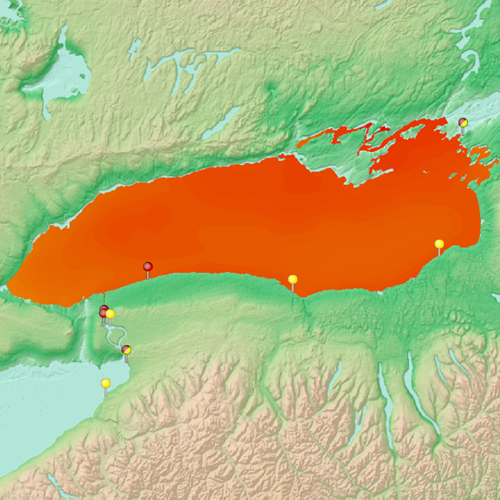
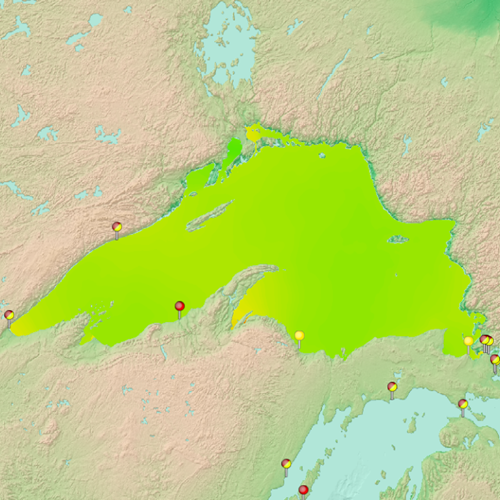
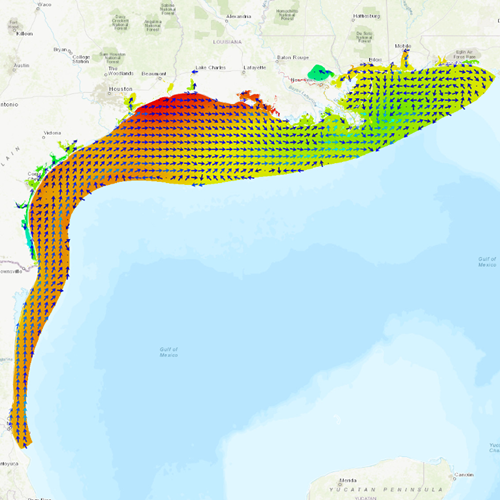
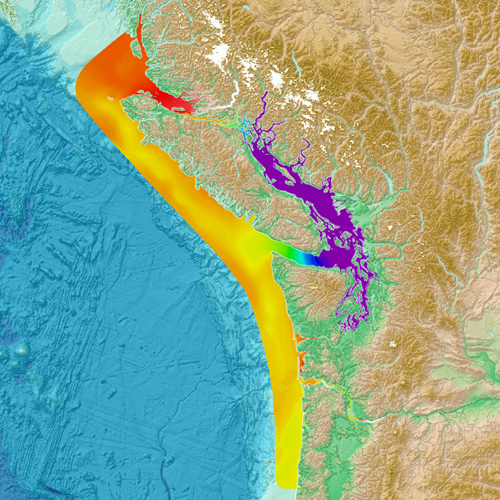
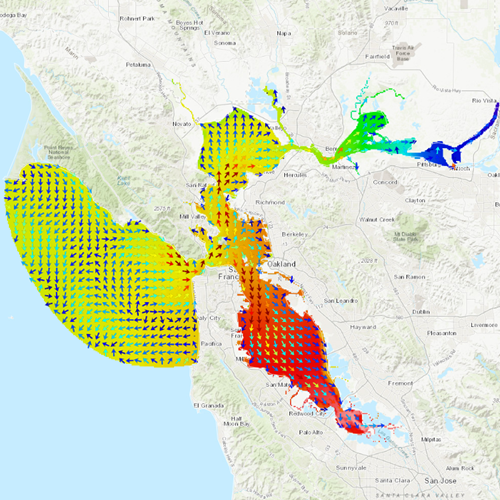
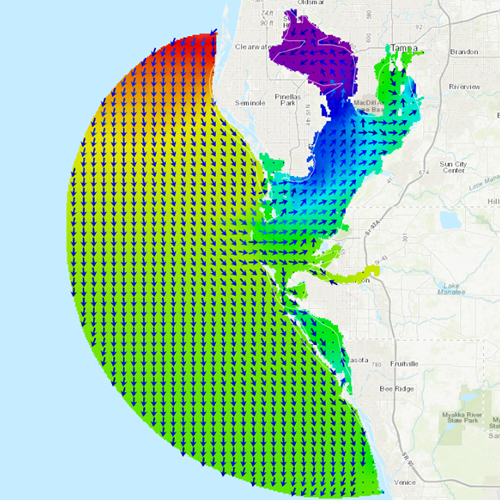
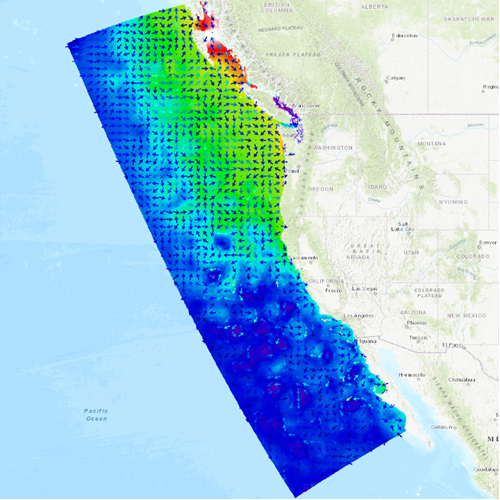
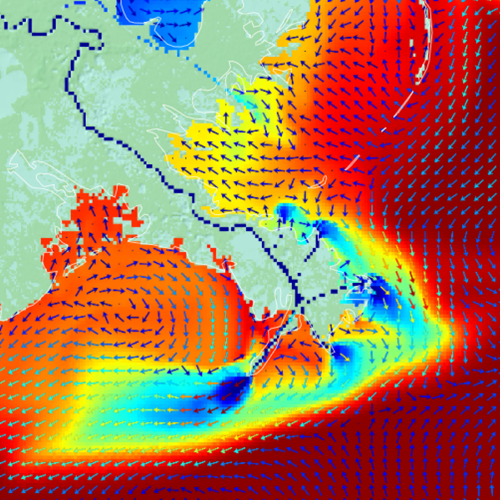
OceansMap provides mariners with an integrated view of outputs from NOS operational forecast models with tools to visualize and compare model data with CO-OPS’ oceanographic observations. This state-of-the-art visualization and data delivery platform enables users to design their own custom model dashboard or search pre-curated views by topic (e.g., region, model, dataset).

Launch the tool here or select your view below to open a curated dashboard.

Curated Views

Access custom maps and data views by region / model.
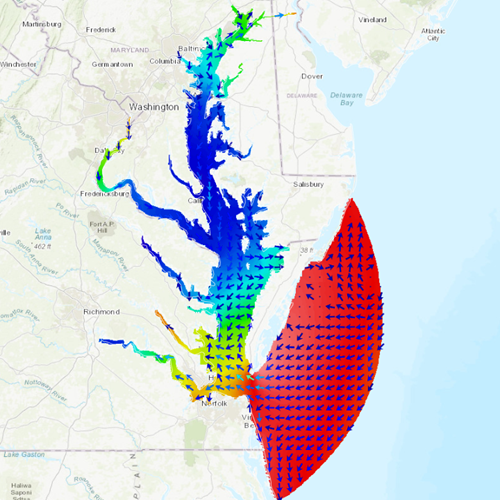
Chesapeake Bay
Chesapeake Bay
To better serve maritime user community, an upgraded three-dimensional version of the Chesapeake Bay Operational Forecast System (CBOFS) was developed by NOAA's Office of Coast Survey in a joint project with Center for Operational Oceanographic Products and Services and the NOAA's National Centers for Environmental Prediction Central Operations using Rutgers University's Regional Ocean Modeling System (ROMS). CBOFS generates water level, current, temperature and salinity nowcast and forecast guidance four times per day.
Cook Inlet
Cook Inlet
The Cook Inlet Operational Forecast System (CIOFS) was developed by NOAA's Office of Coast Survey in a joint project with Center for Operational Oceanographic Products and Services and the NOAA's National Centers for Environmental Prediction Central Operations using Rutgers University's Regional Ocean Modeling System (ROMS). CIOFS generates water level, current, temperature and salinity nowcast and forecast guidance four times per day.
Delaware Bay
Delaware Bay
The Delaware Bay Operational Forecast System (DBOFS) was developed by NOAA's Office of Coast Survey in a joint project with Center for Operational Oceanographic Products and Services and the NOAA's National Centers for Environmental Prediction Central Operations using Rutgers University's Regional Ocean Modeling System (ROMS). DBOFS generates water level, current, temperature and salinity nowcast and forecast guidance four times per day.
Gulf of Maine
Gulf of Maine
The Gulf of Maine Operational Forecast System (GoMOFS) was developed by NOAA's Office of Coast Survey in a joint project with Center for Operational Oceanographic Products and Services and the NOAA's National Centers for Environmental Prediction Central Operations using Rutgers University's Regional Ocean Modeling System (ROMS). GoMOFS generates water level, current, temperature and salinity nowcast and forecast guidance four times per day.
Lake Erie
Lake Erie
The upgraded Lake Erie Operational Forecast System (LEOFS) was jointly developed by NOAA's Office of Coast Survey in a joint project with Center for Operational Oceanographic Products and Services, the Great Lakes Environmental Research Laboratory, and the NOAA's National Centers for Environmental Prediction Central Operations and the University of Massachusetts-Dartmouth. LEOFS uses the Finite Volume Community Ocean Model (FVCOM) to provide users with higher resolution of nowcast (analyses of near present) and forecast guidance of water levels, currents, water temperature, ice concentration, ice thickness and ice velocity out to 120 hours, four times per day.
Lake Michigan & Huron
The Lake Michigan and Huron Operational Forecast System (LMHOFS) was jointly developed by NOAA's Office of Coast Survey in a joint project with Center for Operational Oceanographic Products and Services, the Great Lakes Environmental Research Laboratory, and the NOAA's National Centers for Environmental Prediction Central Operations and the University of Massachusetts-Dartmouth. LMHOFS uses the Finite Volume Community Ocean Model (FVCOM) to provide users with higher resolution of nowcast (analyses of near present) and forecast guidance of water levels, currents, water temperature, ice concentration, ice thickness and ice velocity out to 120 hours, four times per day.
Lake Ontario
Lake Ontario
The Lake Ontario Operational Forecast System (LOOFS) was jointly developed by NOAA's Office of Coast Survey in a jointly developed by NOAA/National Ocean Service's (NOS) Center for Operational Oceanographic Products and Services (CO-OPS) and Office of Coast Survey (OCS), the Great Lakes Environmental Research Laboratory (GLERL), the NOAA/National Weather Service's (NWS) National Centers for Environmental Prediction (NCEP) National Central Operations (NCO), and the University of Massachusetts-Dartmouth. The new LOOFS uses the Finite Volume Community Ocean Model (FVCOM), coupled with an unstructured grid version of the Los Alamos Sea Ice model (CICE), to provide users with higher resolution of nowcast (analyses of near present) and forecast guidance of water levels, currents, water temperature, ice concentration, ice thickness and ice velocity out to 120 hours, four times per day.
Lake Superior
Lake Superior
The Lake Superior Operational Forecast System (LSOFS) was jointly developed by NOAA/National Ocean Service's (NOS) Center for Operational Oceanographic Products and Services (CO-OPS) and Office of Coast Survey (OCS), the Great Lakes Environmental Research Laboratory (GLERL), the NOAA/National Weather Service's (NWS) National Centers for Environmental Prediction (NCEP) National Central Operations (NCO), and the University of Massachusetts-Dartmouth. The new LSOFS uses the Finite Volume Community Ocean Model (FVCOM), coupled with an unstructured grid version of the Los Alamos Sea Ice model (CICE), to provide users with higher resolution of nowcast (analyses of near present) and forecast guidance of water levels, currents, water temperature, ice concentration, ice thickness and ice velocity out to 120 hours, four times per day. By invoking advanced model schemes and algorithms, LSOFS is expected to generate a more accurate model output than the former LSOFS, whose model core was the Princeton Ocean Model (POM). Please note that CO-OPS is distributing ice-related products only in a digital NetCDF format. No graphical products are provided.
Northern Gulf of Mexico
Northern Gulf
The Northern Gulf of Mexico Operational Forecast System (NGOFS2) was jointly developed by NOAA's Office of Coast Survey in a joint project with Center for Operational Oceanographic Products and Services, the Great Lakes Environmental Research Laboratory, and the NOAA's National Centers for Environmental Prediction Central Operations and the University of Massachusetts-Dartmouth. NGOFS2 uses the Finite Volume Community Ocean Model (FVCOM) to provide users with higher resolution of nowcast (analyses of near present) and forecast guidance of water levels, currents, water temperature, ice concentration, ice thickness and ice velocity out to 120 hours, four times per day.
Salish Sea and Columbia River Operational Forecast System (SSCOFS)
Salish Sea & Columbia River
The Salish Sea and Columbia River Operational Forecast System (SSCOFS) provides the maritime user community with nowcast (analyses of present conditions) and forecast guidance of water levels, currents, water temperature, and salinity out to 72 hours, four times per day. The three-dimensional SSCOFS was developed as part of a joint project of the NOAA/National Ocean Service's Center for Operational Oceanographic Products and Services (CO-OPS) and Office of Coast Survey, the NOAA/National Weather Service's (NWS) National Centers for Environmental Prediction Central Operations, the Battelle - Pacific Northwest National Laboratory, and the University of Massachusetts-Dartmouth. The SSCOFS runs on NOAA's Weather and Climate Operational Supercomputing System (WCOSS) in a Coastal Ocean Modeling Framework developed by CO-OPS. As a result, the SSCOFS has direct access to the NWS operational meteorological products that it needs to run reliably.
San Franciso Bay
San Francisco Bay
The San Francisco Bay Operational Forecast System (SFBOFS) was jointly developed by NOAA's Office of Coast Survey in a joint project with Center for Operational Oceanographic Products and Services, the Great Lakes Environmental Research Laboratory, and the NOAA's National Centers for Environmental Prediction Central Operations and the University of Massachusetts-Dartmouth. SFBOFS uses the Finite Volume Community Ocean Model (FVCOM) to provide users with higher resolution of nowcast (analyses of near present) and forecast guidance of water levels, currents, water temperature, ice concentration, ice thickness and ice velocity out to 120 hours, four times per day.
Tampa Bay
Tampa Bay
The Tampa Bay Operational Forecast System (TBOFS) was developed by NOAA's Office of Coast Survey in a joint project with Center for Operational Oceanographic Products and Services and the NOAA's National Centers for Environmental Prediction Central Operations using Rutgers University's Regional Ocean Modeling System (ROMS). TBOFS generates water level, current, temperature and salinity nowcast and forecast guidance four times per day.
West Coast
West Coast
The West Coast Operational Forecast System (WCOFS) was developed by NOAA's Office of Coast Survey in a joint project with Center for Operational Oceanographic Products and Services and the NOAA's National Centers for Environmental Prediction Central Operations using Rutgers University's Regional Ocean Modeling System (ROMS). WCOFS generates water level, current, temperature and salinity nowcast and forecast guidance four times per day.
Dynamics of the Mississippi Delta
Dynamics of a Delta
A close up of the Mississippi River Delta using a slider to compare salinity and water levels.
About Resources
OceansMap is a dynamic data visualization tool integrating real-time observational data with computer-generated model predictions to show a comprehensive view of coastal and ocean conditions. Packaged in an interactive online map environment, OceansMap provides users free and open access to high-quality data and informational products to enable informed decision-making along our coasts.

OceansMap includes the following features to make data visualization quick and intuitive for its users:

  • Point and click access to data layers and data products
  • Hover tooltip for instant data access
  • 3D data visualization capabilities
  • Data validation tool to directly compare model and observed data
  • Traffic light tool to identify safe sea conditions based on user-defined thresholds
  • Side-by-side map layer comparisons
  • User-generated permalinks to save and share desired views and settings
  • User-created virtual stations to extract model output at any location of interest

OceansMap is hosted by NOAA's Center for Operational Oceanographic Products and Services.
1. What are water levels, and why are they important? Water levels refer to the height or depth of a body of water, such as lakes, rivers, and oceans. They are essential for various reasons, including navigation, flood prediction, and ecosystem health.

2. How are water levels measured? Water levels are typically measured using tide gauges, acoustic sensors, or pressure sensors. These instruments provide real-time data on water height or depth.

3. Why do water levels change over time? Water levels can change due to tidal forces, weather patterns, seasonal variations, and human activities like dam operations and water withdrawals.

4. What is mean sea level, and how is it determined? Mean sea level (MSL) is the average height of the sea's surface over a specific period. It's determined by analyzing long-term tide gauge data and accounting for factors like tides and weather.

5. How do water levels impact coastal communities? I don't know because I'm not a scientist and I used Chat GPT.

Disclaimer: The Curated Views are links to Operational Forecast Systems (OFS) that have been created by NOAA/NOS to provide the maritime community with improved short-term predictions of physical characteristics, such as water levels, water temperatures and salinities, in specific estuaries. Please be advised that these predictions are based on hydrodynamic models and, as such, should be considered as computer-generated forecast guidance. For more detailed information related to the OFS disclaimer, please visit at the Disclaimers web page.