- Back to Stations Listing
-
Back to Stations Map
- Documentation below will be revised
-
to reflect recent changes to the Tool
- Limitations and Uncertainties
- User's Guide
-

CO-OPS Frequency and Duration of Inundation Analysis Tool
Discussion of Limitations and Uncertainties
The Center for Operational Oceanographic Products and Services'Inundation Analysis Tool provides summary statistics, which include the number of occurrences and duration of inundation events above a specified threshold elevation for a desired time period of observation. Water level data collected from NOAA National Water Level Observation Network (NWLON) and historical tide stations are used to generate these analyses. Based on CO-OPS' experience using this tool to analyze data and apply statistics for inundation frequency and duration, several limitations in the use of the tool and inherent uncertainties in the results have been noted.
The uncertainty of the analyses is dependent upon the length, seasonality, datum and measurement errors of the data record. Datum errors for tide stations range from approximately 1 to 5 centimeters. Additionally, measurement errors for high and low water tides range from approximately 1 to 2 centimeters. Measurement errors are estimated to ensure data quality and determine total uncertainty.
CO-OPS has found that statistical distributions are dependent upon seasonal changes; therefore, it is recommended that analyses be performed over a one-year minimum duration. Typically, differences between distributions based on a one-year record and a five-year record are much less than differences between distributions based on a one-year record and a three-month record. The larger differences can be attributed to the seasonal variability within the dataset. If desired, seasonal statistics can also be produced by analyzing each season over the period of record for each year and averaging.
The Inundation Analysis Tool is used for two main purposes. The first is to correlate statistics with simultaneous field measurements and/or oceanographic and meteorological data for a specific duration. This purpose is demonstrated in Case 1: Accounting for accuracies of datum elevation thresholds. Secondly, it is used to estimate statistics of frequency and duration for a long time period using a relatively short observation record, which is illustrated in Case 2: Extrapolation of Statistics for Longer Time Periods of Observations.
Case 1: Accounting for Accuracies of Datum Elevation Thresholds
The accuracy of tidal datum elevations used as threshold values is highly dependent upon the length of the series over which the data were collected. The statistical distributions are known to have significant seasonal dependencies, and also may have significant variability from year to year.
Uncertainties in the results will be dependent upon the error in the water level measurements and upon error in the threshold datum elevation. In general, a longer time series will increase the accuracy of the tidal datum elevation. If verified data from a long-term NOAA NWLON station are used, the measurement error and datum error combined are less than 0.01m, which will have a minor impact on the results. Conversely, if data used are from a short-term 3-month water level station, then the measurement errors are typically 0.02m and 0.05m for datum elevation (total uncertainty: 0.07m, 95% Confidence Interval). Figures 1 and 2 illustrate how significant differences may appear in statistical distributions between the upper and lower confidence limits if the measurement and datum error approach 0.07m for the Pensacola, Florida tide gauge station. A similar pattern, of large differences in the Confidence Interval bands for frequency and duration of inundation can also be seen in figures 3 and 4, for the San Francisco, CA inundation statistics. However, when the measurement errors are at 0.01m with a 95% CI, there is very little difference in the statistical distributions. Figures 5 and 6 illustrate the case of using accurate measurement systems and locations with low datum uncertainty, for Pensacola, FL. Figures 7 and 8, also show the case of low error uncertainty for San Francisco, CA. For purposes of establishing inundation statistics over a defined period of time, using tidal datum thresholds based on a minimum of one year of data are recommended.
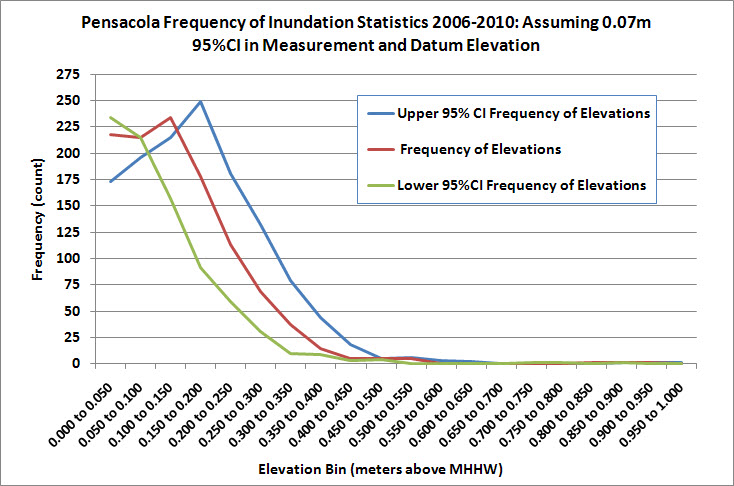
Figure 1. 95% CI bands for frequency on inundation with a 0.07m measurement and datum uncertainty.
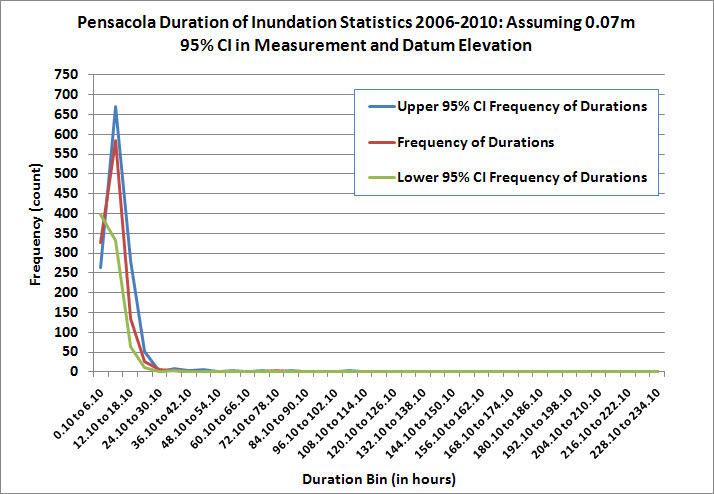
Figure 2. 95%CI bands for duration of inundation with a 0.07m measurement and datum uncertainty.
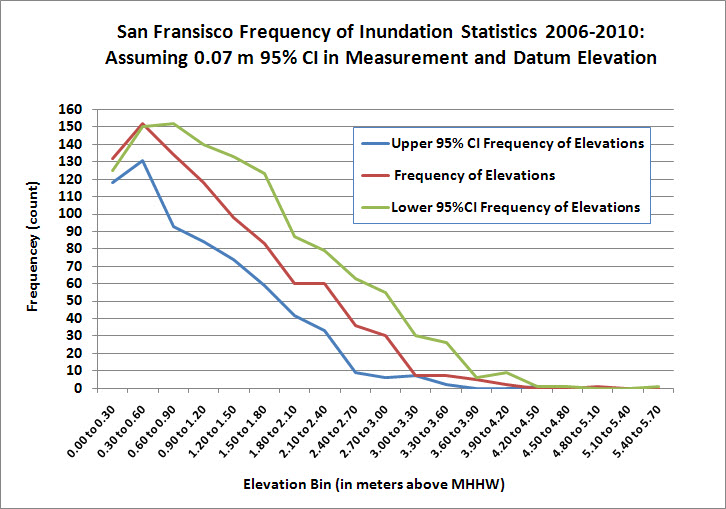
Figure 3. 95% CI bands for frequency of inundation with a 0.07m measurement and datum uncertainty.
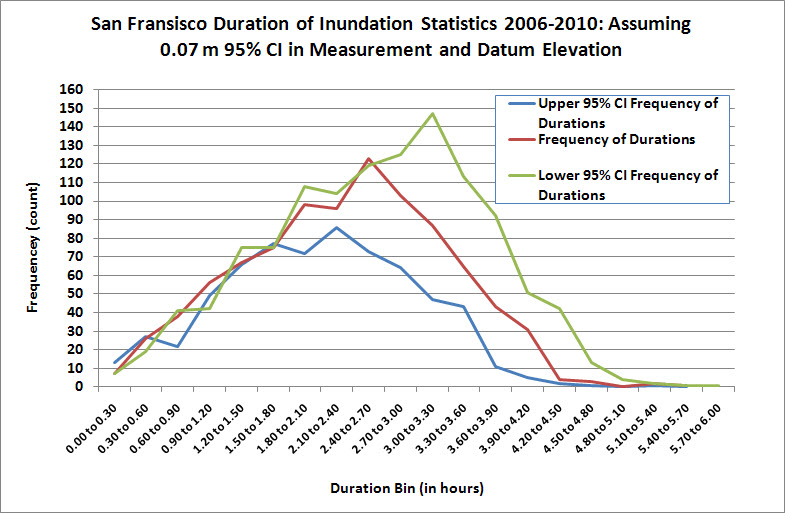
Figure 4. 95% CI bands for duration of inundation with a 0.07m measurement and datum uncertainty.
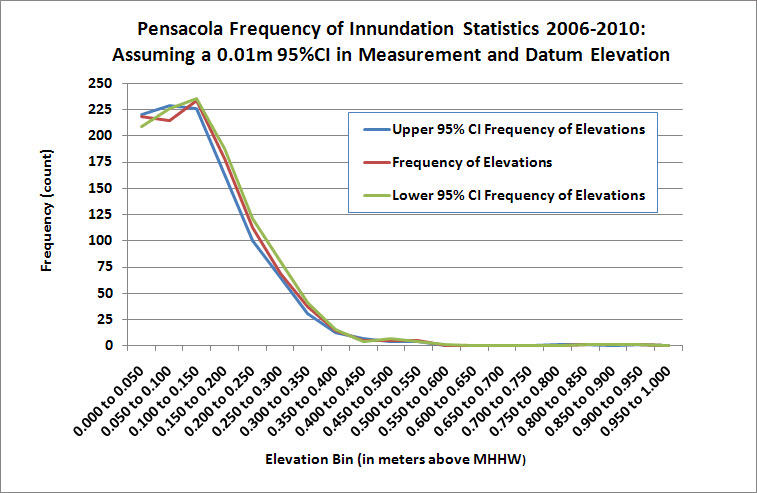
Figure 5. 95% CI bands for frequency of inundation with a 0.01m measurement and datum uncertainty.
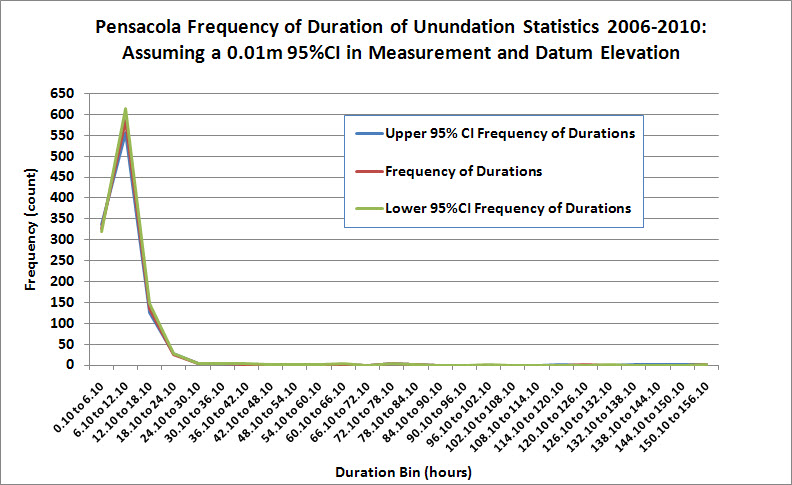
Figure 6. 95% CI bands for duration of inundation with a 0.01m measurement and datum uncertainty.
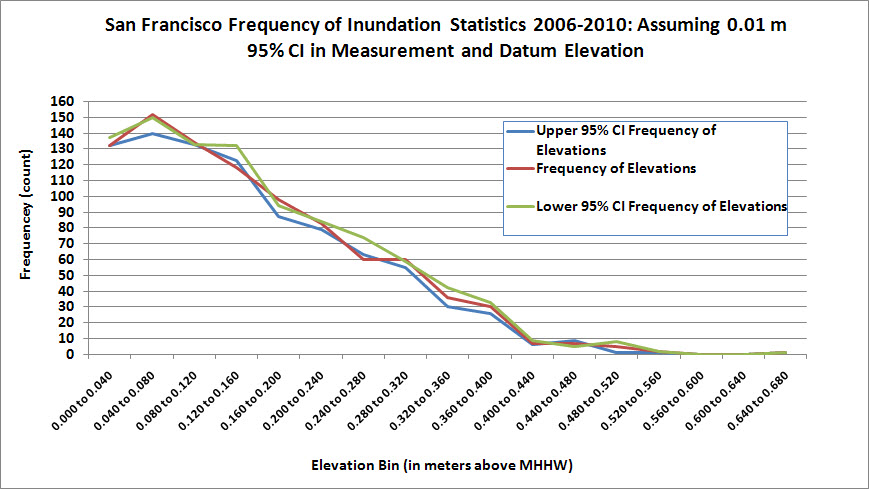
Figure 7. 95% CI bands for frequency of inundation with a 0.01m measurement and datum uncertainty.
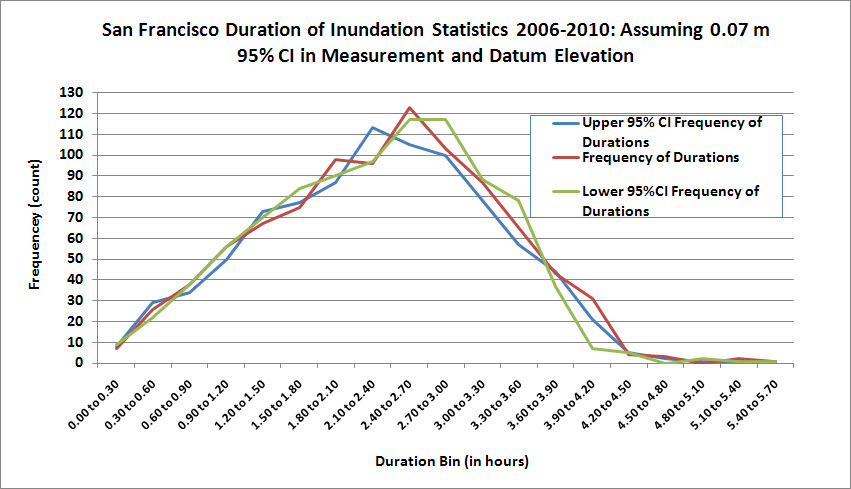
Figure 8. 95% CI bands for duration of inundation with a 0.01m measurement and datum uncertainty.
Case 2: Extrapolation of Statistics for Longer Time Periods of Observations
Statistics derived from shorter time periods (i.e. seasonal) can be used to extrapolate statistics of longer time periods (i.e. several years) and will have similar results for limitations and uncertainties as in the first case study. The extrapolation adds to the uncertainty of the statistics. The additional uncertainty is dependent upon how well the statistics from the shorter time period agree with the statistics from the longer time period. To perform an extrapolation, compare the statistics of a shorter time period station with statistics of a longer time period from a nearby long-term station using a simultaneous time period. If the comparison is highly correlated, then the statistics from the long-term station could be used to estimate statistics for the shorter term location.
Since seasonal effects are often quite significant and are more variable, at the minimum a one year record should be used to compare with a nearby station to properly estimate long-term statistical distributions. Caution must be used when only using 3-months of data for purposes of extrapolation. Long-term analyses were performed over a 5-year period at two (2) NWLON stations, to assess variability and its contribution to uncertainty. The analyses were performed for one-year and three-month (seasonal) statistics and compared to the five-year statistics. Figures 9 and 10 below show the ranges of uncertainty at Pensacola, FL for each bin when comparing a one-year maximum yearly cumulative frequency and a one-year minimum cumulative frequency with the five-year analysis. Figures 11 and 12 show similar distributions for San Francisco, CA tide station.
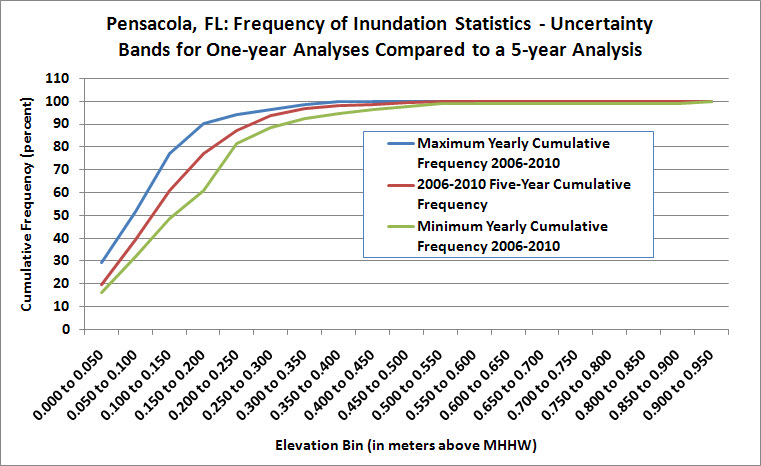
Figure 9. Comparison of frequency of inundation statistics between one-year and five-year time series.
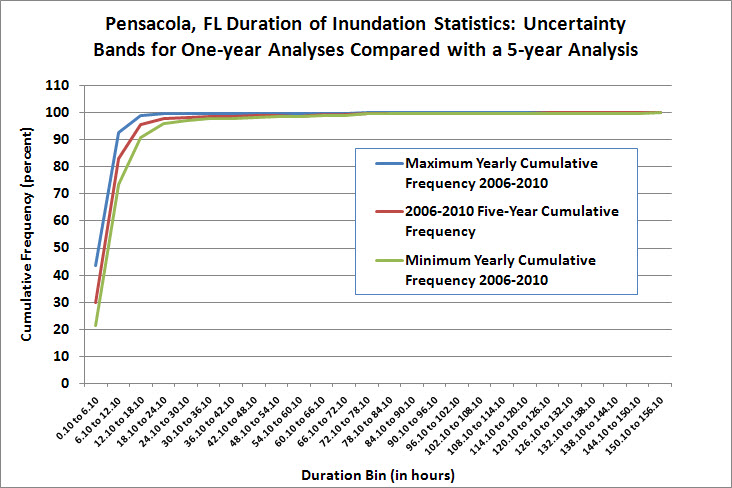
Figure 10. Comparison of duration of inundation statistics between one-year and five-year time series.
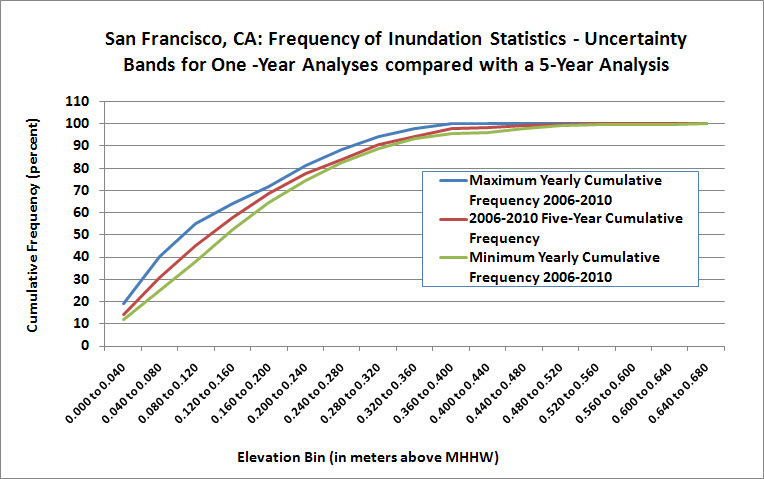
Figure 11. Comparison of frequency of inundation analyses statistics between one-year and five-year time series.
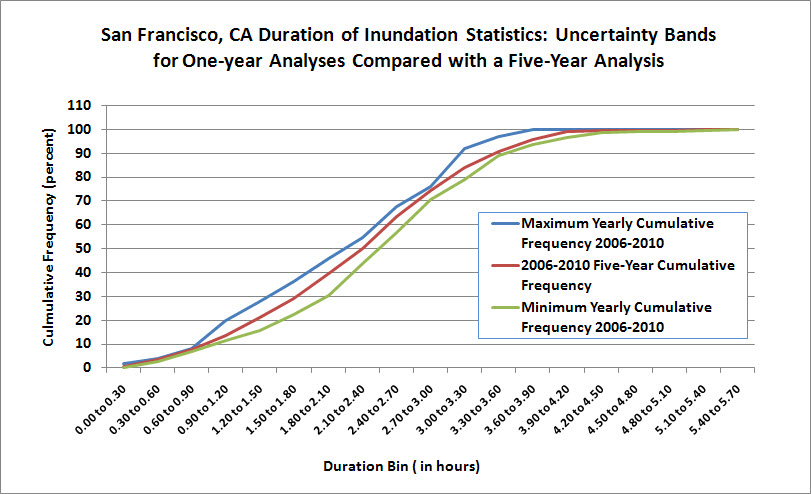
Figure 12. Comparison of duration of inundation analyses statistics between one-year and five-year time series.
Figures 13 through 16 illustrate the ranges of uncertainty for each bin when
comparing a three-month seasonal analysis to a five-year analysis. The width of
the uncertainty bands for each bin is comparable for both frequency and duration,
if not slightly wider than for the one-year comparisons. Figures 13 and 14 show
the disadvantages of using a shorter (3-month or one-year) time series at
Pensacola. Uncertainties increase when a shorter time period is used to estimate
long term frequency and duration of inundation statistics, because shorter time
periods do not accurately represent the variability of the data set. The water
levels at Pensacola vary significantly from season-to-season and year-to-year.
This variability is caused by the relatively low range of tide and strong
meteorological effects on the water levels at that location. Figures 13 through
16 illustrate the statistical analysis for a summer season; however, the
variability of the distributions for the other seasons has similar results when
compared to longer 5-year distributions.
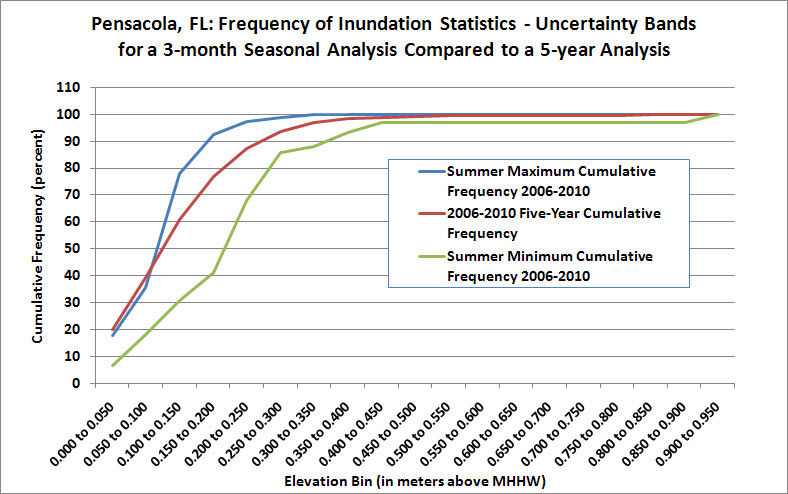
Figure 13. Comparison of frequency of inundation statistics for a 3-month Summer seasonal analysis with a 5-year analysis.
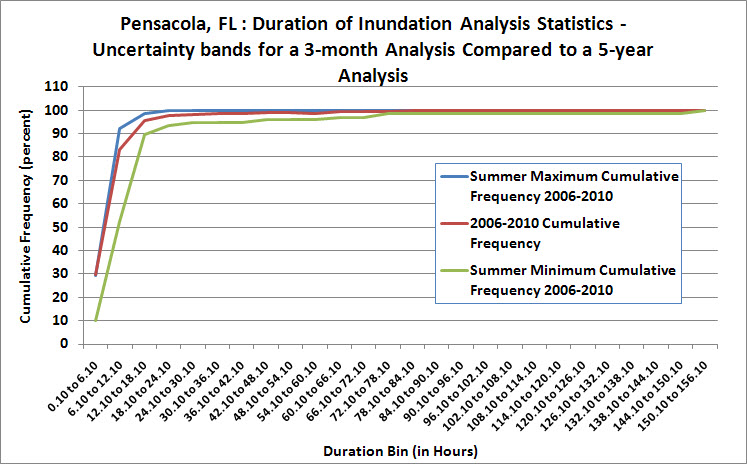
Figure 14. Comparison of duration of inundation statistics for a 3-month Summer seasonal analysis with a 5-year analysis.
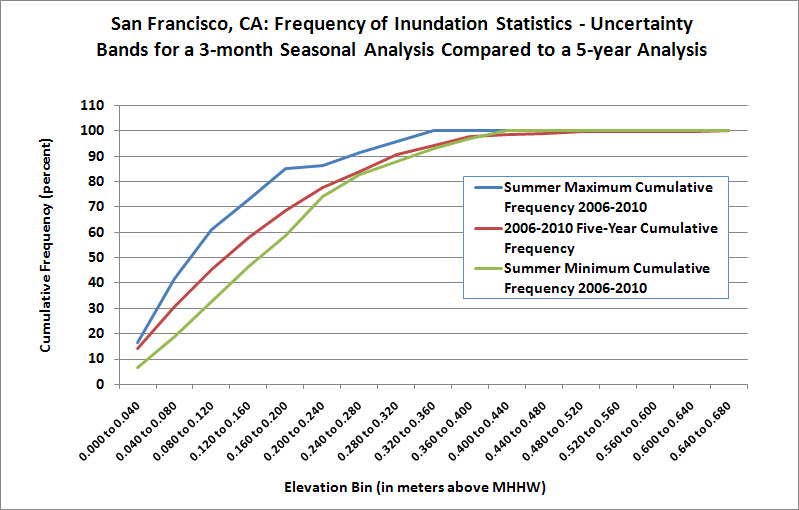
Figure 15. Comparison of frequency of inundation Statistics for a 3-month Summer seasonal analysis with a 5-year analysis.
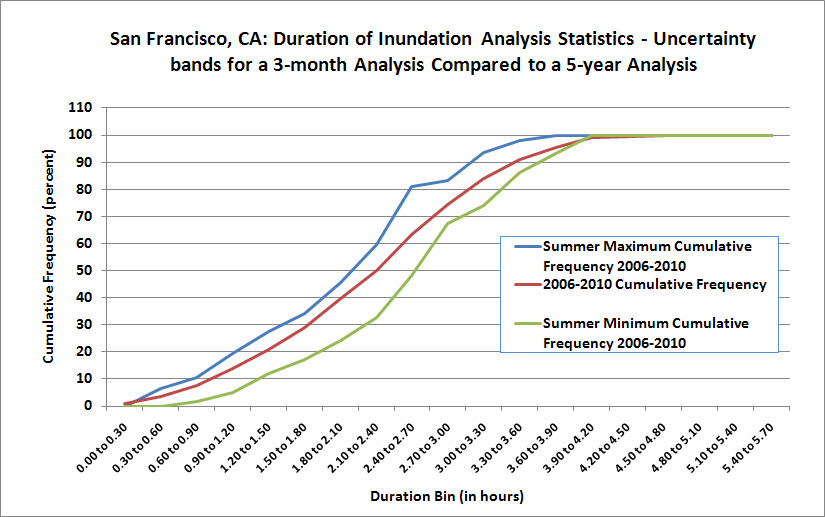
Figure 16. Comparison of Duration of Inundation Statistics for a 3-month Summer seasonal analysis with a 5-year analysis.